One business dashboard for sales, stock and cash
The E-Khata Cloud dashboard is the first screen you see after login, and it shows your business in real time: total sales, cash and credit, money customers owe you, payables, net position, product count and invoices. Every card and chart recalculates the moment a new invoice, payment or stock entry is saved.
The E-Khata Cloud business dashboard is a live command screen that reads from the same ledger as the rest of the ERP and shows your headline numbers, charts and quick actions in one place. Because it computes from the database on every request, the figure on a card is the figure in your books at that second. Three views, Sales, Inventory and Accounts, cover the whole business.
Three views: Sales, Inventory and Accounts
The dashboard is split into three independent tabs, each with its own widget layout. The active tab is held in the URL so you can bookmark or share the exact view you want. A new business starts on a curated default layout, and a Reset button restores the recommended arrangement for that tab at any time.
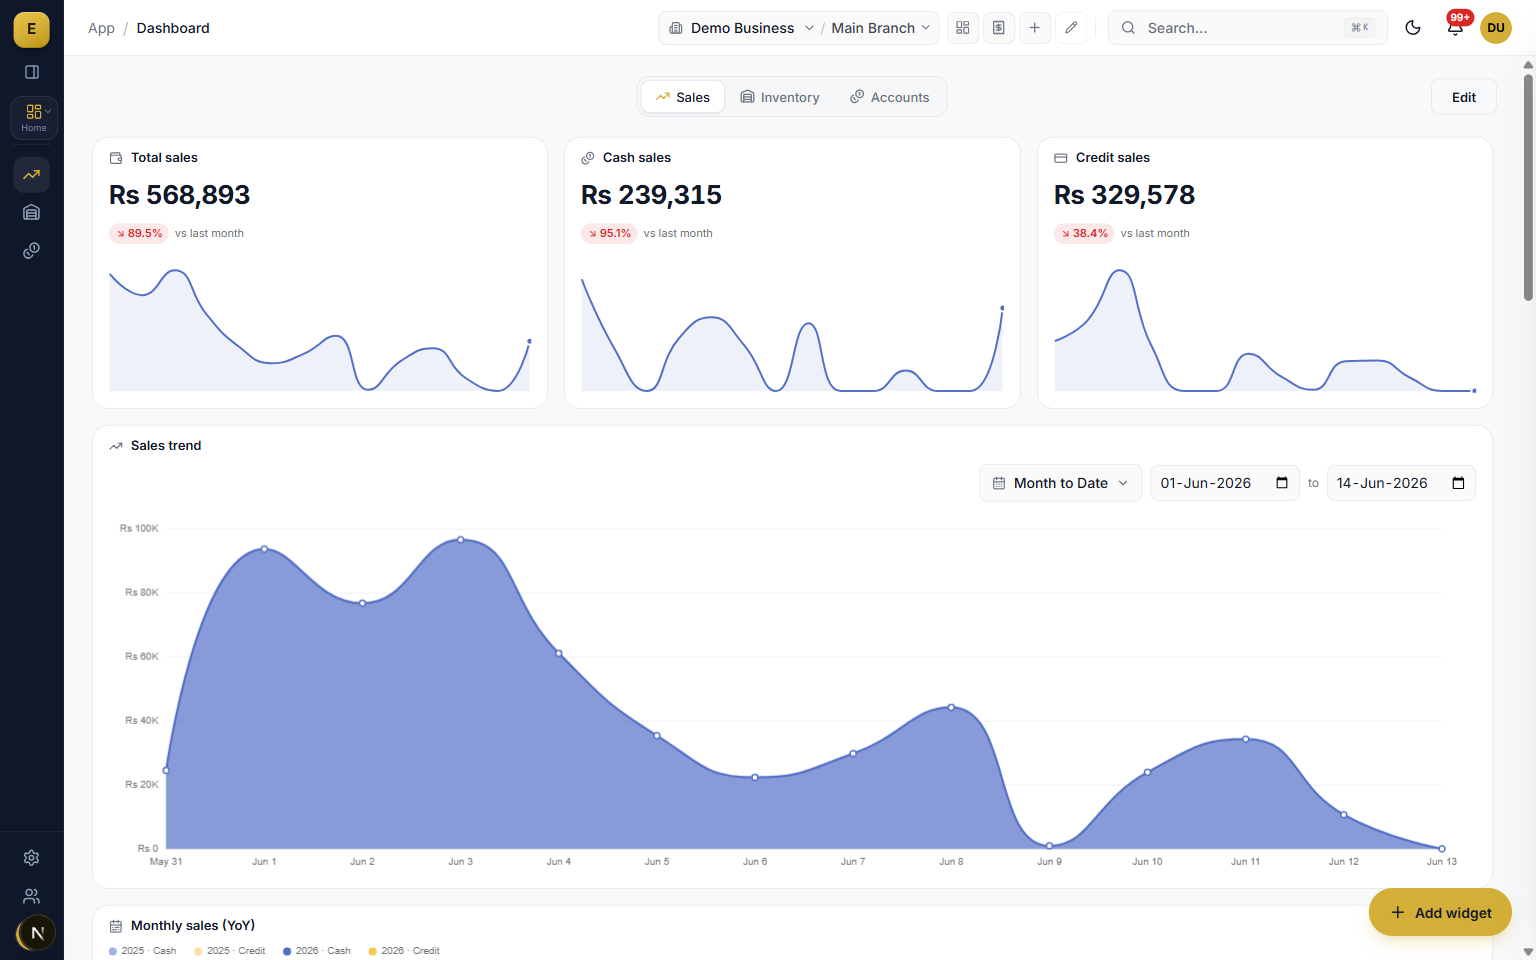
- Sales view answers how trade is going with KPI cards, a sales trend, top customers and products, invoice status and a recent activity feed.
- Inventory view shows stock value by warehouse and category, daily in and out movement, low-stock alerts and turnover gauges.
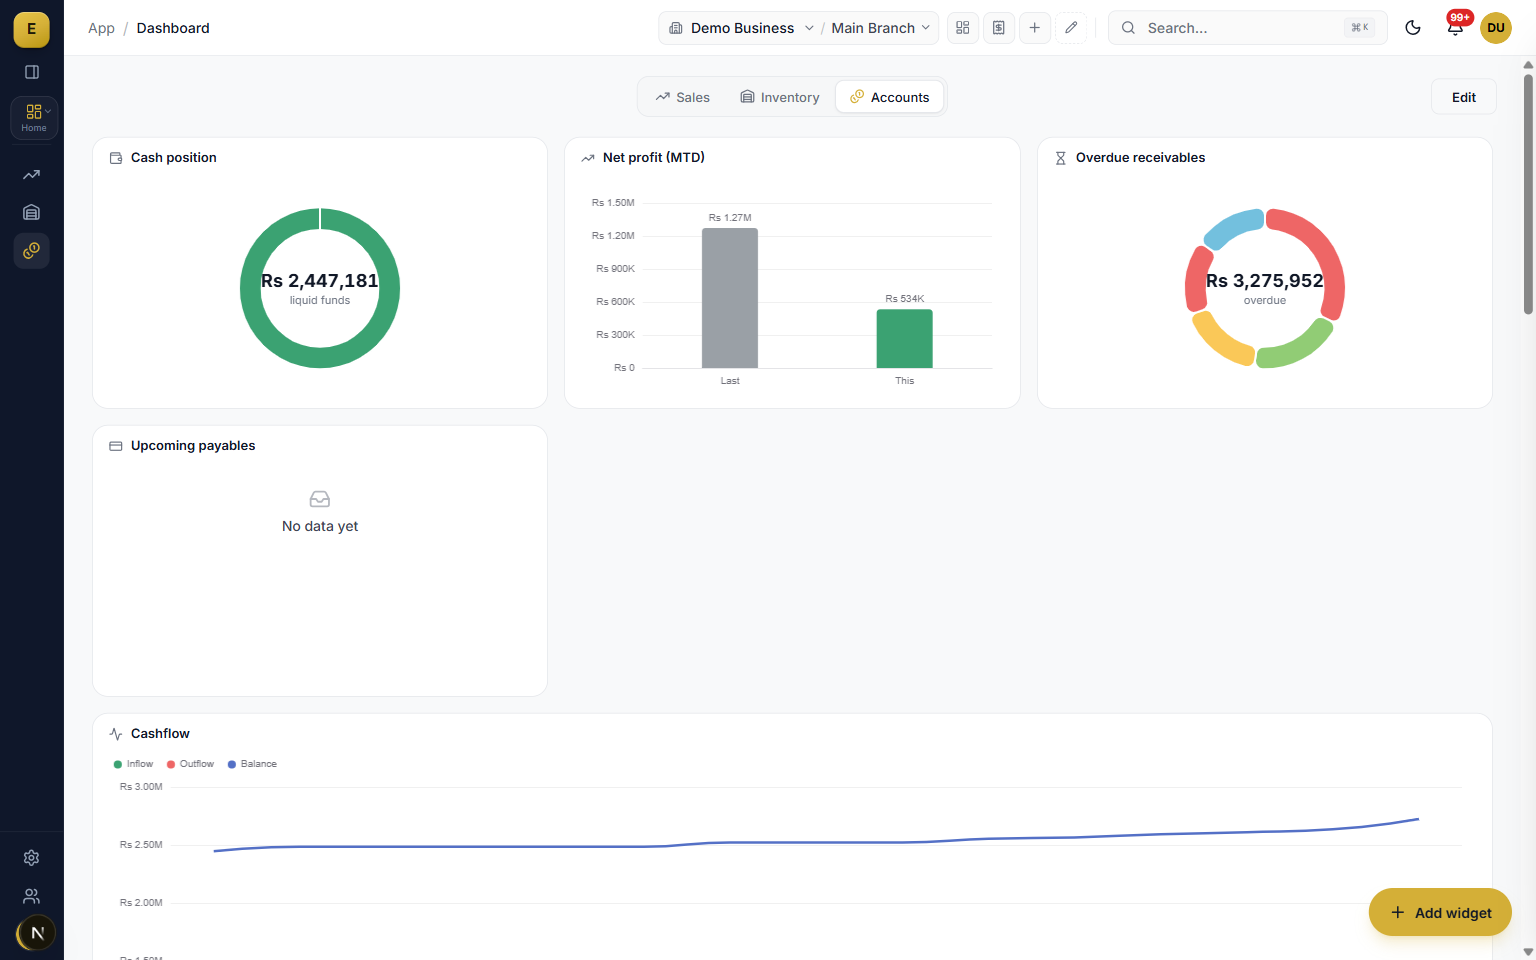
- Accounts view carries cash position, today's sales, overdue receivables, upcoming payables, net profit and a cashflow forecast.
- Each tab refetches only when you are looking at it, so an unviewed tab costs nothing.

The Accounts view is the money screen
The Accounts view brings cash, profit and collections together. It carries cash position with a breakdown by account, today's sales with a month-on-month comparison, overdue receivables, upcoming payables due in the next seven days, net profit month-to-date against the prior month, a 14-day cashflow forecast and a tax filing summary comparing input and output sales tax.
- Cash position with a per-account breakdown.
- Overdue receivables listing the top parties with days overdue.
- A 14-day cashflow forecast with a running balance.
- Cheques maturing this week and a sales tax filing summary.
Live KPI cards with trend and sparkline
Six headline cards sit across the top of the dashboard: Sales MTD, Receivables, Payables, Net Position, Products and Invoices. Each card shows the live value, a percentage change against the previous period, a short change label, and a small sparkline of the recent trend. The numbers are computed against real ledger data, so Receivables comes from customer balances and Net Position is receivables minus payables.
- Sales MTD, Receivables, Payables, Net Position, Products and Invoices.
- Each card carries a live value plus a comparison against the prior period.
- A sparkline draws the recent trend so direction is visible at a glance.
Charts that read at a glance
Charts use a fixed business-intelligence colour palette with no gradients, so the data stays readable rather than decorative. The library covers the chart types a Pakistani SME actually needs. Where a number tells you what happened, the chart tells you the shape of it: the slow week, the seasonal spike, the customer whose balance keeps climbing.
- Sales trend line and monthly year-on-year columns.
- Revenue mix donut, top customers and top products.
- Stock-by-warehouse treemap and a cashflow forecast with a running balance.
- Receivables aging and gauges for turnover and dead stock.
Drill down and start work from the dashboard
The dashboard is a starting point, not a dead end. Widgets are clickable, so opening a receivables total takes you to the invoices behind it, and a sales figure leads to the orders that make it up. Quick Actions gives one-click shortcuts to create an invoice, raise a purchase order or record a payment, while the Recent Activity feed shows a live timeline of invoices, payments and stock entries, newest first.
- Click any widget to move from a number to the exact documents in two clicks.
- Quick Actions opens the right module with context already filled in.
- Recent Activity lists the party, amount, document number and a relative time.
Date range and branch filters, real time throughout
A sticky filter bar sits under the header and controls every widget on screen at once. You can switch between presets like Today, This week, MTD, QTD and YTD or pick a custom range, and a compare toggle adds period-over-period change. A branch selector scopes the data to one shop or warehouse, or shows the business as a whole. Every dashboard endpoint computes live from the database and is tagged, so any change anywhere refreshes the figures.
- Presets plus custom start and end dates, with a compare-to-previous-period toggle.
- A branch filter for a single location or a combined view of every branch.
- Every card and chart refetches for the chosen range and branch.
- Curated default layouts ship for Owner, Sales Manager, Inventory Manager, Accountant, Branch Manager and Cashier.
Who it is for
Frequently asked questions
Explore more of E-Khata
دیکھیں کہ آپ کا کاروبار ای کھاتا پر کیسے چلتا ہے۔
30 منٹ کی زوم یا واٹس ایپ کال۔ ہم آپ کو ای کھاتا دکھائیں گے۔

“میں یا میرا کو-فاؤنڈر ہر ڈیمو کال میں خود شامل ہوتا ہوں۔”
یا واٹس ایپ پر پیغام بھیجیں: +92 300 1676722 (1 گھنٹے میں جواب)۔